Plotting Citi Bike Station Activity with NetworkX & Plotly
New York's climate, being continental, receives four distinct seasons — spring (March–May), summer (June–August), autumn (September–November), and winter (December–February). Citi Bikes are a much-loved mode of transport in New York, and the comprehensiveness of the data collected by Citi Bike is every data analyst's dream come true.
This study observes the relationship between Citi Bike ridership and the frequency of use at different stations to answer the question: is there a significant difference in the ridership of Citi Bikes over the seasons?
It's easy to hypothesize that there is — no one really wants to ride a bike in the freezing cold. The interest is in seeing how it shows up in the data.
The Data
Data was sourced from Citi Bike System Data via the public S3 tripdata bucket. Four representative months were sampled — February, May, August, and November 2021 — corresponding to each season.
The entire year's dataset could have been used, but the primary aim is to establish a methodology and observe patterns, rather than form a hypothesis and verify it. The data covers the Jersey City and Hoboken area, with 84 unique docking stations.
Ridership by Season
Total trips by season, 2021. Source: Citi Bike System Data.
The seasonal difference is staggering. August alone accounts for 46% of all sampled trips — nearly 19 times the volume of February. The system effectively hibernates in winter, with just 4,881 trips across the entire month.
What's also notable is the membership split. In February, 81% of riders are members — the committed year-round cyclists. By August, casual riders overtake members at 56%, drawn out by warm weather and recreational routes along the waterfront.
Ridership by Time of Day
Trips per hour of day, by season. Commute peaks at 8am and 5–6pm persist across all seasons.
The hourly pattern tells its own story. Across every season, there's a clear morning commute peak around 8am and an evening peak at 5–6pm. This dual-peak signature is strongest in the warmer months when the absolute volume is higher, but the shape persists even in February's tiny sample.
The evening peak consistently outweighs the morning, suggesting the system serves more return-commute and after-work recreational trips than morning commutes.
Station Activity
Top 10 stations by total trip starts across all 4 months.
The experiment is not concerned with comparing the volume of activity between two months. Rather, it focuses on the relative activity at Citi Bike docking stations within each month's time frame, and the inter-station connectivity.
Grove St PATH leads as the most-used station overall with 9,252 trips across four months. The waterfront walkway stations and Hoboken Terminal follow closely — all transit-adjacent hubs that serve both commuters and recreational riders.
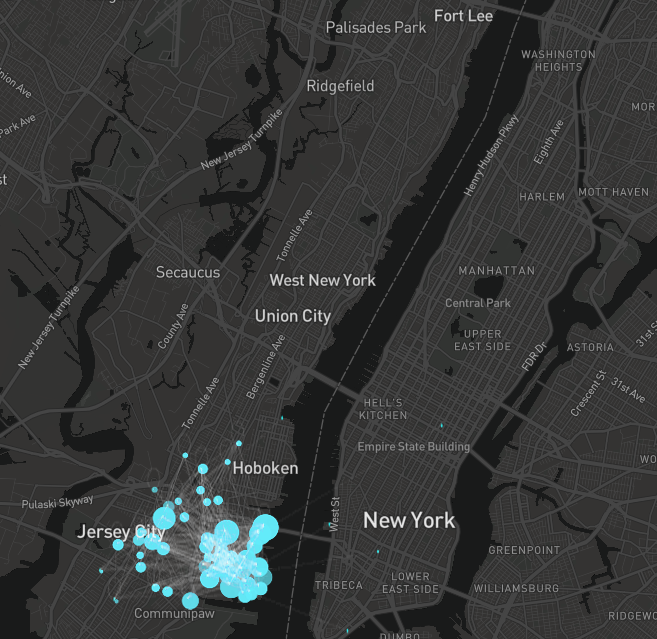
The Network
Using NetworkX, we built a directed graph for each month. Stations are nodes positioned by their real latitude and longitude — the graph layout mirrors actual geography. Hover over stations to see trip counts; use the season buttons to see how the network changes.
The network expands dramatically from winter to summer — not just in volume but in geographic reach. In February, the graph is tight and concentrated around PATH stations. By August, it spreads across the entire Hoboken waterfront with new peripheral stations lighting up.
Who Rides?
Member vs casual rider breakdown by season. Casual riders dominate summer.
The membership composition shifts dramatically across seasons. Winter is a member's game — 81% of February rides come from annual subscribers. But by summer, casual riders make up 56% of trips, drawn to the waterfront and recreational routes that define the Jersey City/Hoboken network.
This has real implications for system planning. Member-heavy months are predictable (commute patterns), while casual-heavy months generate more recreational, longer-distance trips that stress different parts of the network.
Key Findings
- Summer ridership is ~19x winter — 93,800 trips in August vs 4,881 in February.
- The active network expands 57% — from 56 nodes and 1,156 edges in February to 111 nodes and 4,367 edges in August.
- Commute peaks persist year-round — dual peaks at 8am and 5–6pm appear in every season.
- Casual riders dominate summer — flipping from 19% in Feb to 56% in Aug.
- Self-loops are common — round trips at waterfront stations (South Waterfront Walkway: 1,147 self-loops in August) signal recreational use.
- Hub stations maintain centrality — Grove St PATH, Newport PATH, and Hoboken Terminal anchor the network regardless of season.
- Network density is remarkably stable — ~0.35–0.38 across all months, suggesting the graph structure scales proportionally.
Methodology
Each month's data was modeled as a directed graph using NetworkX. Stations are nodes, positioned by actual latitude/longitude. Trips between station pairs become directed edges, weighted by trip count. Four centrality measures were computed: degree, eigenvector, betweenness, and closeness.
Connection maps were produced by overlaying NetworkX graphs on Plotly scatter plots. Photoshop's skew tool was needed to match map projection distortions — a manual step that future iterations would automate with proper geographic projections.
Tools: Python, pandas, NumPy, NetworkX, Plotly, Folium, geopandas, shapely, scikit-learn, Matplotlib, Seaborn
Future research: It would be interesting to see how this data varies over a full year, and how post-pandemic ridership compares to these 2021 patterns.
Originally published December 19, 2021 as part of Introduction to Urban Informatics, Columbia GSAPP (Professor Boyeong Hong). Source code and notebooks on GitHub.
This article was originally published on Medium with interactive charts hosted on Plotly Chart Studio. Chart Studio has since been discontinued, so the original embeds no longer render. This version recreates those visualizations using D3.js with the same underlying data from the project repository.