Computer Vision for Ethnographic Research
My master's thesis - can a machine read a storefront? A computer vision pipeline that scans street view imagery for the languages and colors of storefront signage, and tests whether they can flag neighborhood demographic change before official data sees it.
The Question
Sociology has long argued that when a neighborhood's people change, its businesses follow - Min Zhou's ethnic-entrepreneurship work built the canonical version of that claim. My thesis tests its converse: read the businesses instead - the languages on their signs, the colors they choose - and detect the people changing, earlier than any census table shows it.
The setting is the ethnoburb, Wei Li's name for the suburban ethnic business cluster. The instrument is computer vision over street view imagery, which quietly photographs every storefront in America every few years. If signage is legible at scale, the commercial landscape becomes a demographic sensor.
The Method, on a Detroit Street
One block of Conant, read across five of street view's passes. A Bangla video store and a Korean taekwondo hall in the late 2000s give way to Yemeni service shops and Arabic storefronts by the 2020s - the kind of turnover the census records years late, if at all. Toggle the year, and drag to look around.
Three Cities
The thesis screened candidate cities on two axes: the vintage of their ethnic enclaves - New York's date to the early twentieth century, Detroit's largely to its second half - and their urban geography, from Manhattan's density to Los Angeles's polycentric sprawl to Detroit's low-rise suburban corridors. The proposal's original third city was San Francisco; Los Angeles replaced it by spring as the enclave literature and data pulled west. A method that reads storefronts has to work across all three landscapes.
Detroit
The Great Migration built the city's Black working class around the auto industry (Sugrue); Syrian, Lebanese, and Palestinian migration in the early twentieth century seeded what is now one of the largest Arab American populations in the country (Li). A Chinatown rose and fell; Japanese, Korean, and Vietnamese arrivals followed the industry after the war. Detroit's enclaves are the youngest of the three - late twentieth century, and suburban.
Enclave vintage: late 20th c. | Form: low-rise, corridor-bound
Los Angeles
The Latino share of the city grew from 10% in 1940 to 48% in 2019; the Asian share from under 1% to twelve points. The Chinese Exclusion Act of 1882 redirected migration into the Japanese, Filipino, and Korean communities that became Little Tokyo, Historic Filipinotown, and Koreatown (Wu). Freeway-era dispersal spread commerce into exactly the strip-mall form the pipeline reads (Scott).
Latino share 1940-2019: 10% → 48% | Form: polycentric
New York
The deepest enclave record: Chinatown dates to the mid-1800s, and the city's Asian population grew from 1.1 million in 2000 to 1.5 million in 2019, with Flushing and Sunset Park as its commercial anchors. Pyong Gap Min's comparison of Korean enclaves - Bergen County's suburban concentration against Queens's multiracial mix - is the clearest evidence that the form of an enclave shapes community power, not just its presence.
Asian population 2000-2019: 1.1M → 1.5M | Form: dense, vertical
Detroit went first: its enclaves are young enough that street view's archive covers their formation, its suburban strip-mall form puts signage at camera height, and the pipeline could be stress-tested inside a funded University of Michigan study of Asian and Arab American placemaking in the region.
The Search
The ground truth
Every dot is a cluster of businesses from the Data Axle historic record: 63,193 unique Detroit-area establishments across 25 annual snapshots, 1997 to 2021. This is the ground truth that says what actually occupied each address when the camera drove past.
Counts per square kilometer; latest period shown
The churn
The map cycles through six four-year slices of the record, 1997 to 2020. Corridors thicken, thin, and migrate - and every flip is turnover the census only registers years later. This churn is exactly what storefront signage should be able to narrate.
Period shown top-right; one full cycle every seven seconds
The camera's memory
Now the same map shows Google's archive: 3,561,914 panoramas inventoried by walking the street network through the metadata API. Deep teal cells were first photographed back in 2007; pale ones joined the record a decade later. The time machine is real, but its floor varies block by block.
Cell color = earliest photographed year, 2007 to 2022
Why here
The pilot needed a corridor with deep imagery, real turnover, and multilingual signage. The dashed box is the thesis's exact test bounds on Metro Parkway: two strip malls in Madison Heights, where Oakland meets Macomb County, in the region's Arab and Asian commercial belt - 9,237 panoramas inside.
Dashed box: the exact pilot bounds
Down to the sign
Inside the box, the pipeline reads storefronts one panorama at a time. The next section stands you on the road it read - in both years.
Live panoramas below
One Corner, Five Years Apart
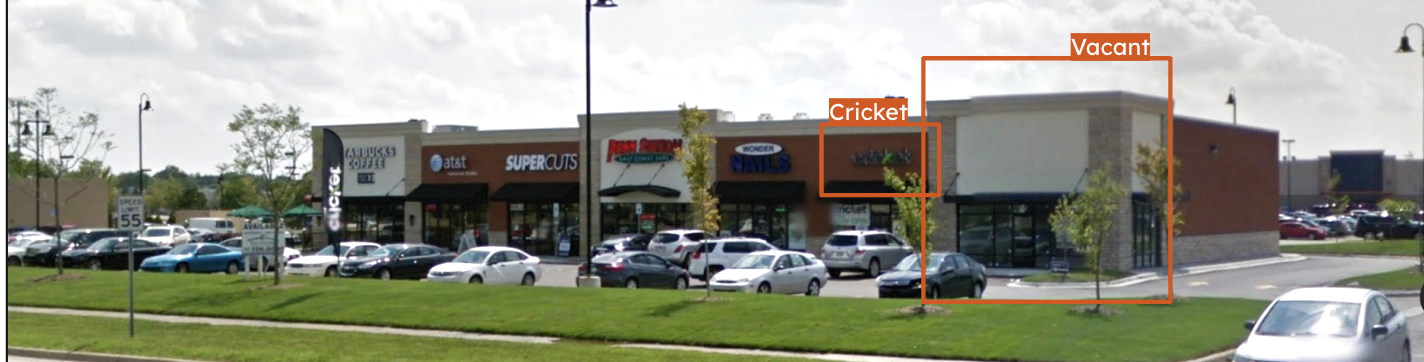 ENCRICKET
ENVACANT
ENCRICKET
ENVACANT
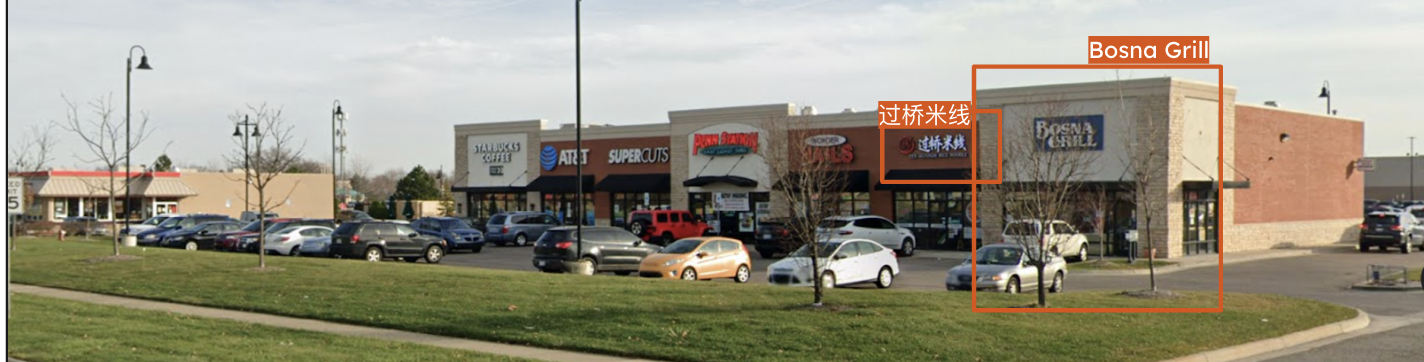 ZH过桥米线 · Ten Seconds Rice Noodle
ENBOSNA GRILL
ZH过桥米线 · Ten Seconds Rice Noodle
ENBOSNA GRILL
过桥米线 - Ten Seconds Rice Noodle - with Bosna Grill next door. July 2015 and November 2020, Metro Parkway, Madison Heights. Live panoramas: 2015 | 2020

The sign that changed the block: Chinese script set above English, the exact bilingual pattern the OCR pipeline is built to catch.
Live panoramas, not stills: the same spot in the pilot's two capture years. Drag to look around; the strip malls sit along the north side.
July 2015 and November 2020 | Metro Parkway, Madison Heights, MI.
The corridor holds more corners than this one. One Corner, Twelve Years follows a strip mall just west of here through every pass in the archive, 2008 to 2020.
The Pipeline
Download
Every panorama arrives in pieces: a 26 x 13 grid of 512-pixel tiles, fetched tile by tile. The pilot pulled 10,002 panoramas this way.
One panorama = up to 338 tiles
Stitch
The tiles assemble into a single 13,312 x 6,656 equirectangular image - the camera's full sphere unwrapped flat at a 2:1 ratio.
88 megapixels per corner of the street
Crop
The top quarter is sky. The bottom quarter is asphalt. A low-rise corridor keeps its signs at eye level, so both are cut before any model runs - half the pixels never needed reading.
The decision that halves the compute
Read
EasyOCR walks the band in nine scripts, and detections lift off the storefronts with their confidences attached: HMART at 0.630, Chinese at 0.886, Korean at 0.671 - real values from the thesis output arrays.
Everything below 60% confidence is gated, but printed
Every stage below is a decision with a reason.
- 63,193 unique Detroit businesses in the Data Axle historic database via Wharton Research Data Services - 5.64M records over 25 annual snapshots, 1997-2021. Decision: ground-truth the imagery against business records, because signage reading means nothing without knowing what was actually there.
- 1,319,464 street coordinates generated by interpolating every 10-20 meters between OSMnx street-network nodes. Decision: Google's API only serves the latest panorama per location, so a custom scraper against the undocumented photometa endpoint recovered the historical archive back to 2007 - 3,561,914 panoramas inventoried, 10.3% of metadata calls returning nothing, and the retry-wrapped scraper closing the metro sweep with an empty error log.
- 9,237 → 577 pilot funnel: panorama IDs inside the Madison Heights test bounds, filtered to 8,734 valid frames, 633 after manual cleaning, 577 in high resolution. Decision: explicit exclusion rules - vehicles with text decals, residential frontage, advertising not attached to an establishment - and the top and bottom 25% of each frame cropped away, because the corridor is low-rise and sky and asphalt carry no signs.
- 4 OCR engines tested across the project's arc: the proposal specified EAST + Tesseract; an eight-language Tesseract pass over 602 stitched panoramas (58,720 detections) showed Bengali costing ~245 seconds per panorama against English's ~32 and forced the switch; the thesis shipped EasyOCR across nine scripts with an adapted pretrained ABINet (Fang et al., CVPR 2021) and stroke-width-transform code compiled for comparison. Decision: engines are disposable, the comparison isn't.
- 60% confidence gate on every detection, with an ASCII check splitting Latin from Asian and Middle Eastern script pipelines and langdetect cross-verifying the language call. Decision: publish the low-confidence tables too - the thesis prints its 0.02-confidence failures next to its successes.
Groundwork: CITI human-subjects certification, October 2022; proposal defended December 2022; thesis jury April 12, 2023.
What the Pilot Read

Findings, Limits, and What Comes Next
- Street view is a usable ethnographic instrument. The pipeline extracts storefront language and color from ordinary street imagery at scale, across nine scripts - the core feasibility claim, demonstrated.
- Language is the strong signal. Script shares in machine-read signage tracked the pilot corridor's actual business mix. Color was noisier: backgrounds and shadows skew extracted palettes, and the thesis documents that rather than hiding it.
- It only works alongside other data. Signage reading needs ground truth - historic business records, census tables - to mean anything. It is a leading indicator, not a standalone measure.
- The archive is the constraint. Historical street imagery thins out fast before the mid-2010s. Tracking substantial change needs more years of coverage than most corridors have - a limit that relaxes every year the archive grows.
- Some change is invisible to the camera. Self-orientalization - businesses performing an ethnic identity for the market - and gentrification that rebrands in the same script read identically to organic change. The method sees signs, not intent.
Where it stops
- The archive has a floor Street view thins out fast before the mid-2010s. Long-horizon change is only measurable where Google drove early; the pilot corridor's record starts in 2007, and most residential blocks start later.
- The ground truth has gaps Data Axle misses the smallest and youngest businesses, and listings lag reality. Records were manually verified and labeled before they were allowed to ground anything.
- The archive is sometimes silent 10.3% of metadata queries returned nothing at all. A coverage map has to mark where the record is empty, not just where it speaks.
- 577 images is a pilot, not a study Two strip malls, one corridor, one time pair. The pilot demonstrates that the reading works; it does not describe Detroit, and the page before this one is careful to never claim it does.
- Color is noisier than language Extracted palettes absorb brick, shadow, and sky along with the sign. Language carried the pilot's signal; color needs masking work before it can carry anything.
- The failures are printed Detections scoring 0.02 sit in the thesis tables next to ones scoring 0.99. The 60% confidence gate is a documented choice, not a hidden one.
The tests still open
- The prediction test. The pilot validated the reading - languages on storefronts, extracted at scale. The experiment it sets up but does not run is the correlation: do signage shifts lead demographic change in the official record? That test is the method's natural next step, and it is still open.
- Two more cities. The three-city design above is the map for it: the same pipeline pointed at Koreatown or Flushing, where enclave vintage and urban form differ from Detroit's corridors in exactly the ways the site research laid out.
- The workaround became a product. In 2023 the historical archive was only reachable by scraping an undocumented endpoint. Google has since shipped official historical Street View access and a Street View Insights API aimed at exactly this kind of temporal analysis - the hardest engineering in the pilot is now a product surface, which lowers the cost of every test above.
Reading a neighborhood is not a neutral act
Pointing computer vision at immigrant neighborhoods carries the risks the thesis names directly: the same pipeline that describes commercial change could feed surveillance or predictive-policing systems, and a model's reasoning is hard to put in front of a community meeting. That is why the tool is framed for planners as descriptive, never predictive-policing adjacent.
This corner spoke English in 2015 and answered in Chinese by 2020, and no table anywhere records the change. Only the pictures do. That is what street view is, underneath: an accidental archive of the storefronts data forgets. Reading it carefully is a way to count them before they are gone.
The Machine, End to End
Sources
- Li, W. (1998). Anatomy of a New Ethnic Settlement: The Chinese Ethnoburb in Los Angeles. Urban Studies
- Zhou, M. (2004). Revisiting Ethnic Entrepreneurship. International Migration Review
- Min, P.G. (2023). The Advantages of Suburban Enclaves over Urban Enclaves for Community Empowerment
- Sugrue, T. (2014). The Origins of the Urban Crisis. Princeton
- Naik, N. et al. (2017). Computer vision uncovers predictors of physical urban change. PNAS