Quality of Life of NYC Children
A composite Quality of Life Index (0–10) for children across NYC's 55 PUMAs, integrating infrastructure access, economic conditions, environmental quality, and social demographics into a single comparable framework.
The Question
Existing quality-of-life indices treat children as a side concern. Yet how kids interact with the built environment — whether they can walk to a library, breathe clean air at school, or live in a household above the rent-burden line — shapes outcomes that ripple across decades.
This project builds a composite Quality of Life Index for children across all 55 of NYC's Public Use Microdata Areas, drawing on the UNICEF Child Friendly Cities Initiative, Arup's Cities Alive: Designing for Urban Childhoods report, and ONE NYC 2050's well-being indicators — and adapting them to the lived geography of New York's five boroughs.
Approach
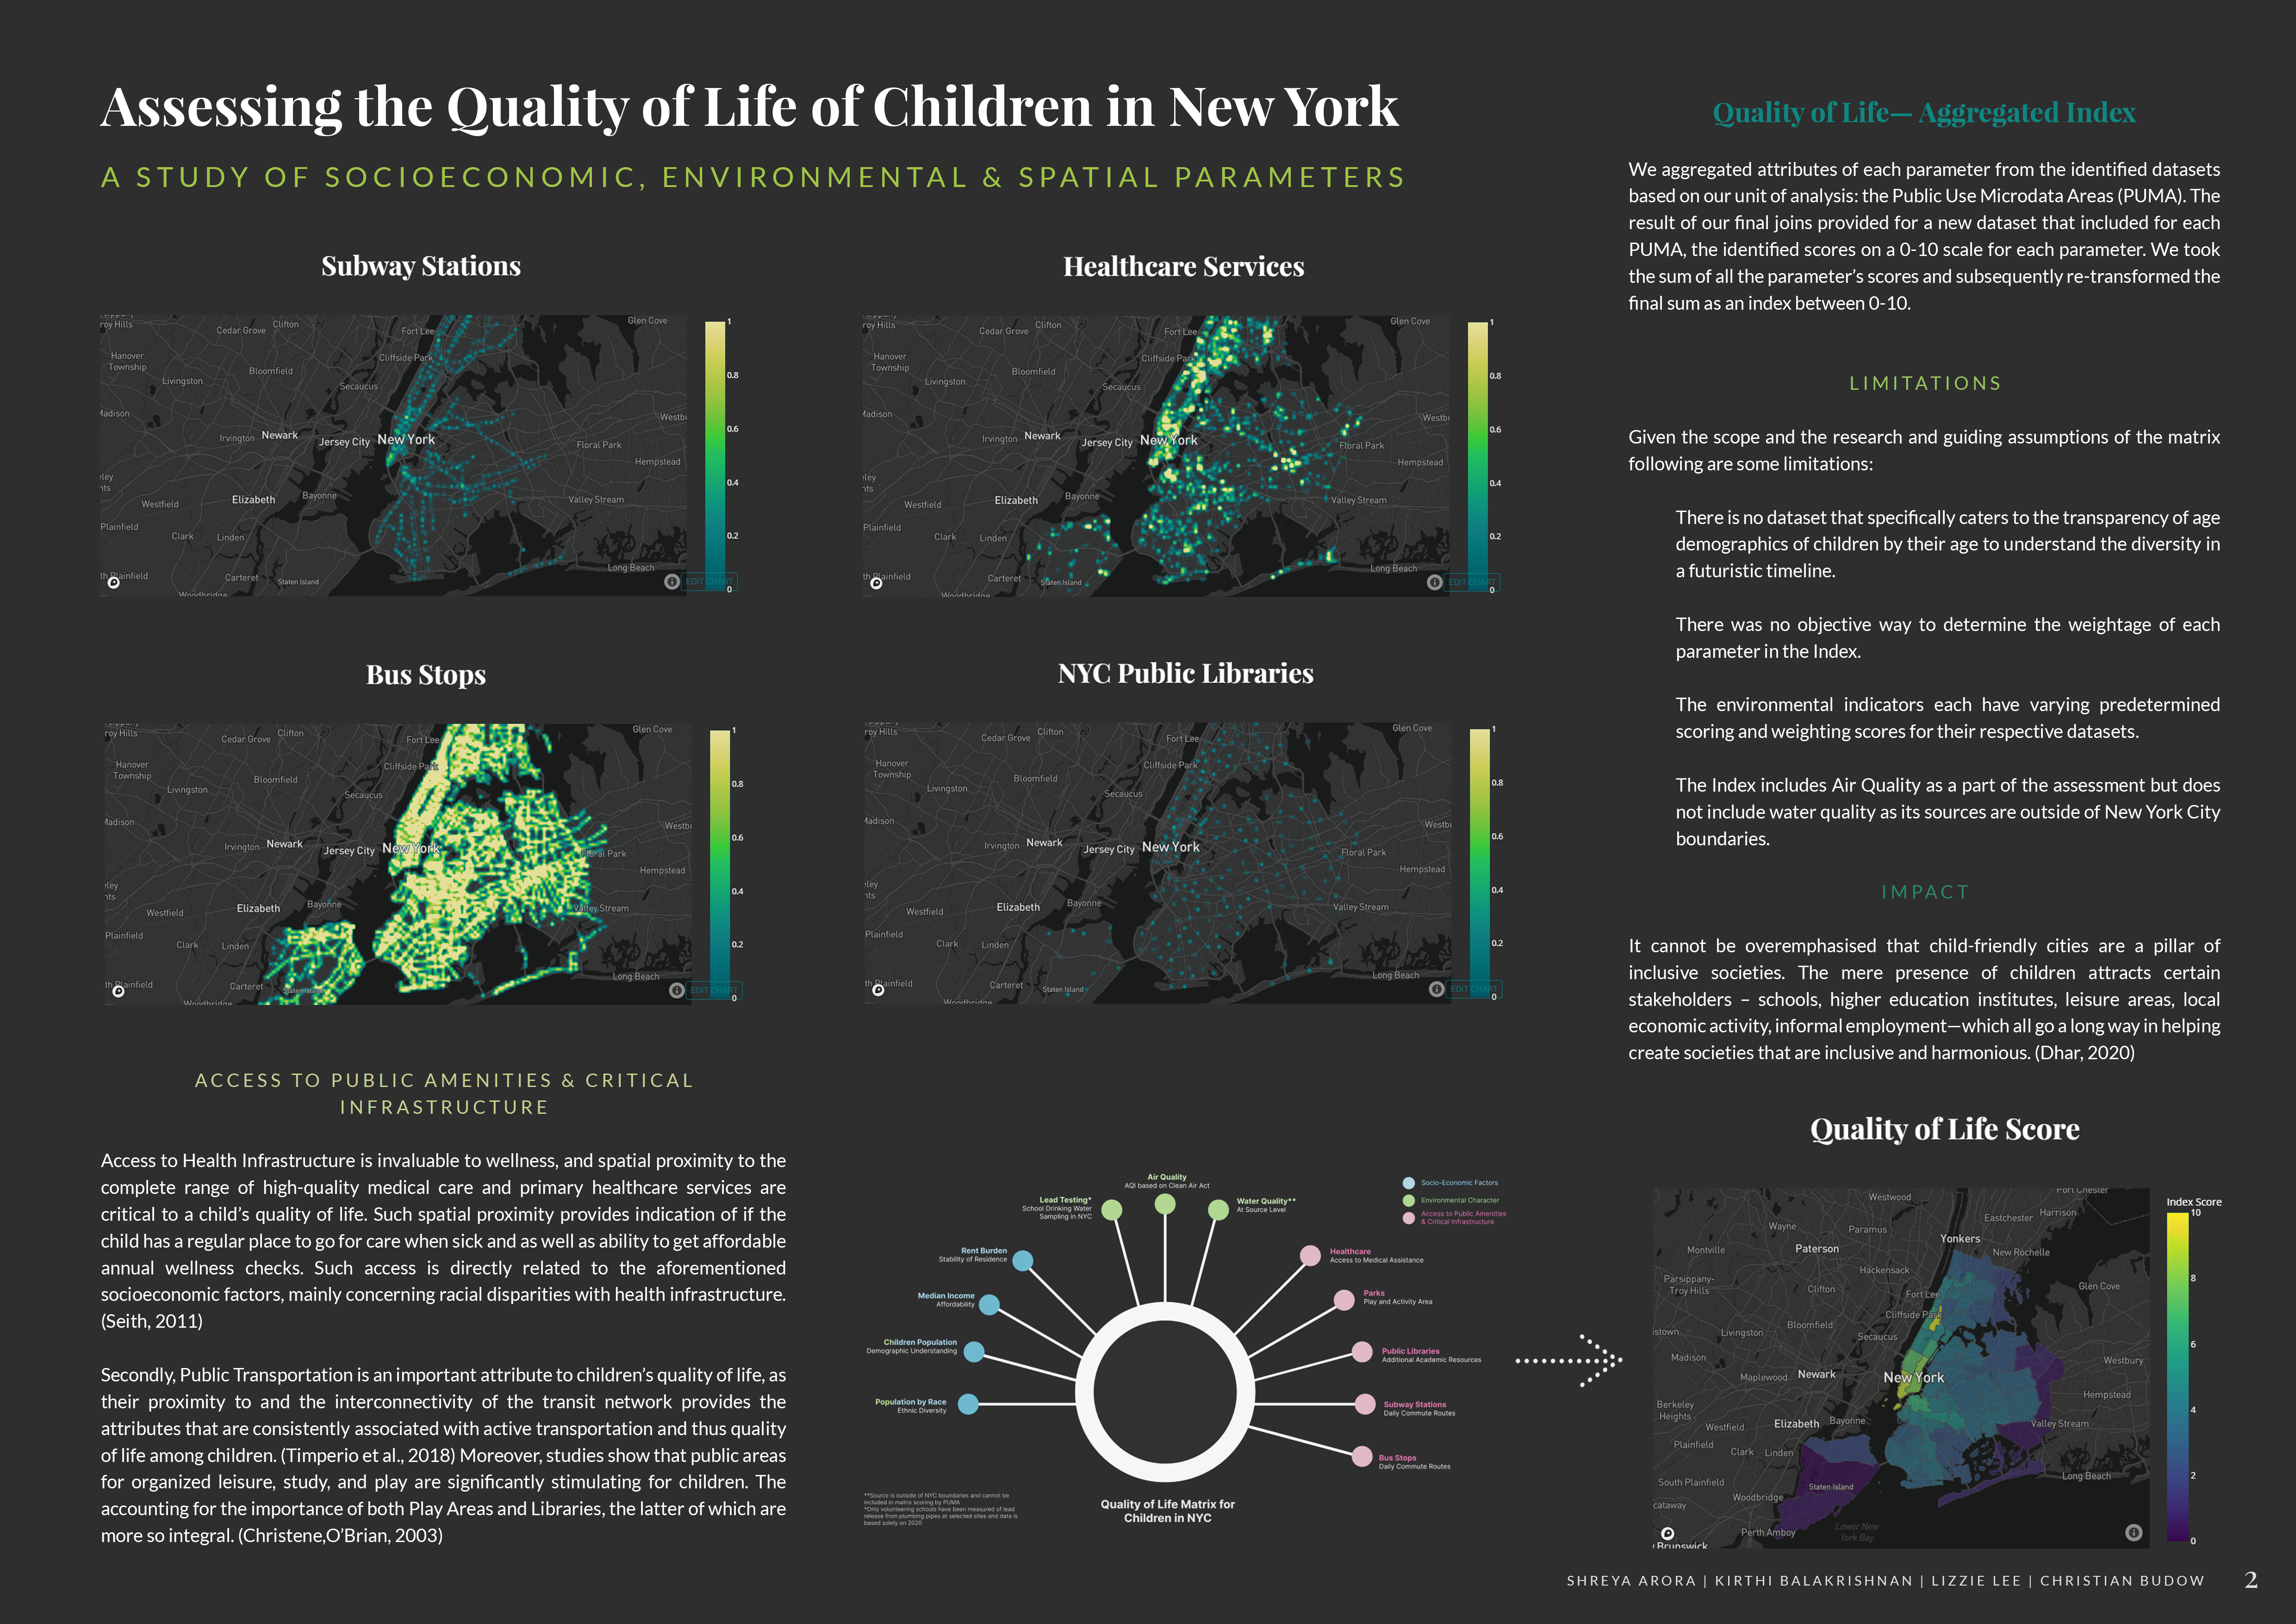
Each domain rolls multiple indicators into a normalized sub-score, then the four are summed and re-scaled to produce a single 0–10 composite. Indicators where lower values are better (PM2.5, rent burden) are inverse-scored so the index reads consistently.
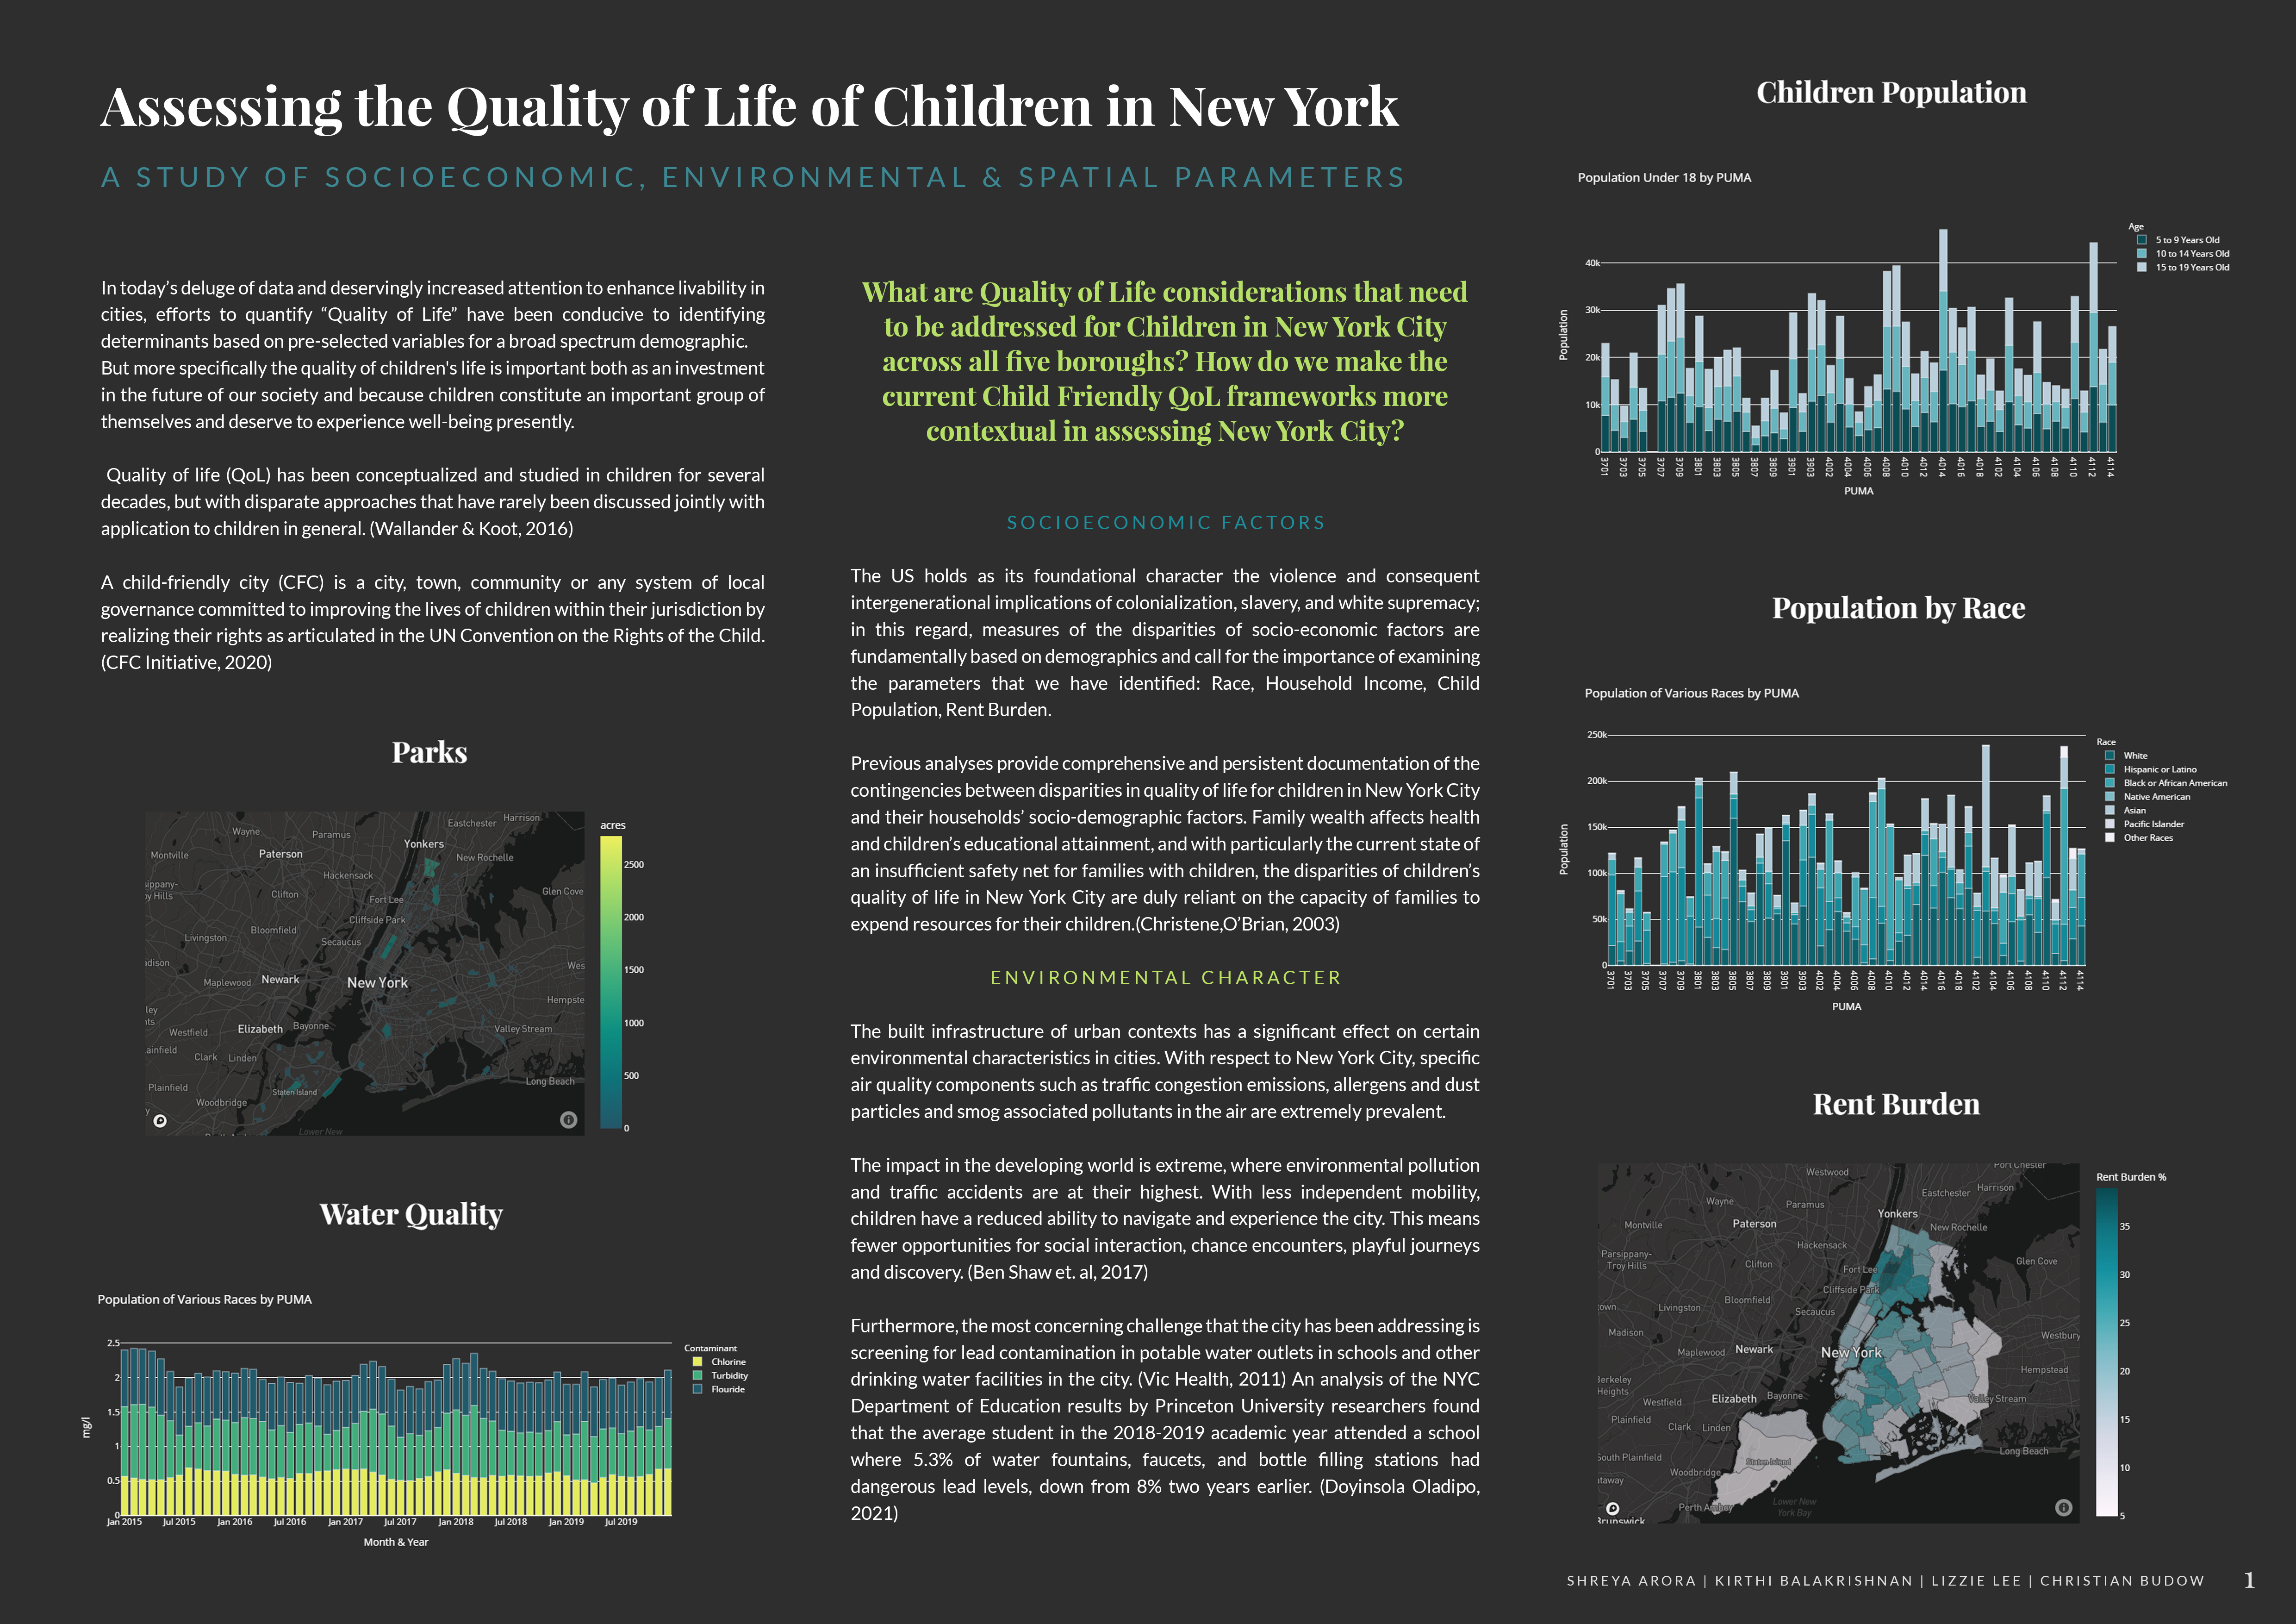
- Access. Density of bus stops, subway stations, healthcare facilities, libraries, and parks per PUMA — NYC Open Data shapefiles.
- Economic. Median household income and rent burden (gross rent as % of income) — 2019 ACS 5-Year Estimates. Rent burden ≥ 35% scores 1.
- Environmental. Fine particulate matter (PM2.5) and water quality (chlorine, turbidity, fluoride) — NYC Open Data Portal APIs.
- Social. Population under 18, age-group breakdowns, and race/ethnicity composition — 2019 ACS 5-Year Estimates.
Python, GeoPandas, scikit-learn (MinMaxScaler), pandas, NumPy, Plotly, Folium, spatial joins on PUMA boundaries.
Outputs
Findings
- Quality of life for children is not legible from any single metric. The PUMAs that score highest on infrastructure access do not consistently score highest on environmental or economic dimensions — a single composite is necessary to capture the full picture.
- Economic and environmental burdens cluster. Rent-burdened PUMAs and high-PM2.5 PUMAs overlap in ways that compound the disadvantage for children growing up in those neighborhoods.
- Existing global frameworks need NYC-specific tuning. UNICEF and Arup's frameworks are useful starting points, but their indicator weightings don't reflect the realities of dense, vertical, transit-rich cities like New York. Tuning the composite to NYC's geography surfaces patterns the global frameworks obscure.